- Home
- ServicesCrafted for Growth
Our development solutions are designed to transform your vision into a thriving success story.
- TechnologiesTech Solutions
We leverage cutting-edge technology to drive efficiency, scalability, and excellence in every project we undertake.
- Contact Us
How AI and IoT Are Automating Quality Inspection: The Software Stack Behind It
Posted By
naxtre
Published Date
30-10-2026
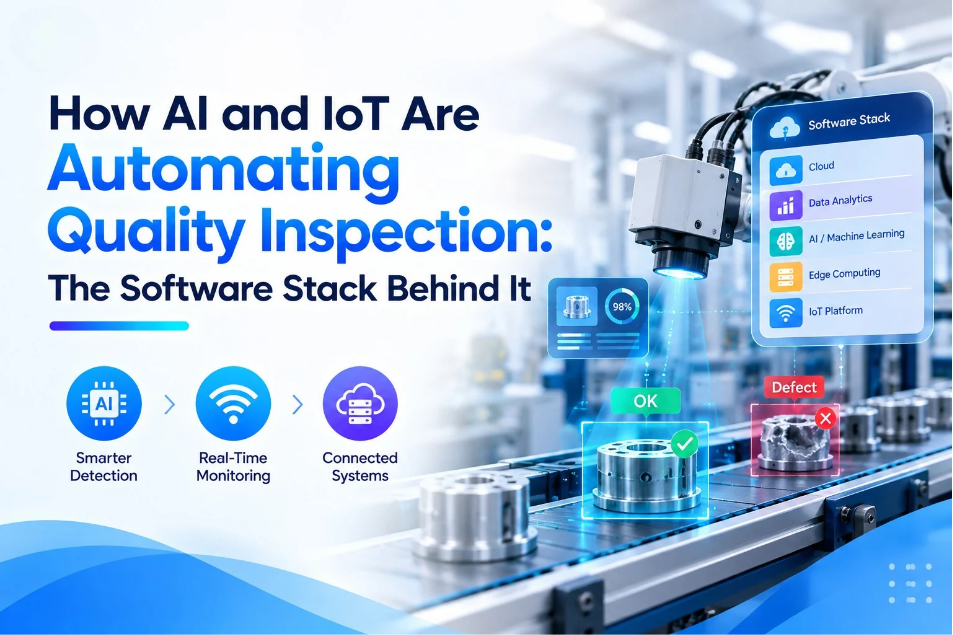
AI IoT quality inspection software connects sensor data streams to machine learning models through four key layers: a device API and edge runtime, a real-time data pipeline, a cloud inference service, and a decision integration layer that writes results to your existing systems. Getting each layer right in software is what separates a pilot that works in a demo from a system that holds up at production scale.
Key Takeaways
- AI IoT quality inspection is primarily a software integration challenge, not a hardware procurement problem.
- The data pipeline layer (MQTT broker, message queue, event bus) determines whether your system scales or collapses under load.
- Edge inference APIs reduce inspection latency to under 50ms; cloud-only inference cannot meet real-time line requirements.
- Model drift is the most common cause of inspection degradation six months after launch; a retraining API solves it.
- OPC-UA and REST are the two integration protocols your software must support to connect to factory MES and ERP systems.
- Build vs. buy depends on how frequently your defect taxonomy changes, not on budget alone.
- The teams that succeed treat inspection as a software product with a roadmap, not a one-time deployment.
Why Quality Inspection Is Now a Software Architecture Problem
Five years ago, automating quality inspection meant buying a vision system from a vendor and bolting it onto the line. The hardware did the work. The software was an afterthought.
That model is breaking down. Modern production environments generate sensor data from dozens of sources simultaneously. A single inspection station might combine a vision camera, a laser profilometer, an acoustic sensor, and a load cell. The hardware exists and works. The problem is the software layer that aggregates those streams, runs inference against them, makes a decision, and writes that decision back to the right system in time for it to matter.
The companies that are getting measurable results from AI IoT quality inspection software are not the ones who bought the most expensive cameras. They are the ones who built the most reliable software integration between their sensors and their production systems.
The Four Software Layers Every AI IoT Inspection System Needs
Layer 1: The Device API and Edge Runtime
The first software decision is where your model runs and how devices talk to it. This is an API design question before it is a machine learning question.
If you call a cloud endpoint for every inspection event, you add 200 to 800 milliseconds of network round-trip to every decision. On a line running 60 units per minute, that latency means the unit has moved past your rejection gate before the decision arrives. The inspection result is accurate but useless.
Edge inference solves this by exposing a local REST or gRPC API that devices call directly. The model runs on an edge server or gateway within the factory network. Typical latency: 15 to 45 milliseconds.
The edge runtime options, by use case:
- TensorFlow Lite Serving: Lightweight, well-supported for ARM and x86 edge hardware. Good default for vision CNNs.
- ONNX Runtime with REST wrapper: Framework-agnostic. Works with models trained in PyTorch or TensorFlow. Strong community support.
- NVIDIA Triton Inference Server: GPU-accelerated. Right choice when throughput is high and you need concurrent model serving across multiple inspection stations.
- FastAPI with custom inference: When you need full control over preprocessing, batching logic, and response formatting. More engineering effort but maximum flexibility.
The edge API contract matters as much as the model. Define your request schema (sensor payload format, image encoding, metadata fields) and your response schema (defect class, confidence score, bounding coordinates if applicable) before you train anything. This keeps your ML work decoupled from your integration work.
Layer 2: The Data Pipeline (This Is Where Most Projects Break)
The data pipeline is the most underengineered layer in most inspection projects. Teams spend months on model accuracy and days on the pipeline. Then the pipeline fails in production and the model never gets a chance to perform.
The pipeline has three jobs: ingest sensor data reliably, route it to the right processing stage, and retain it long enough to replay when something goes wrong.
The two dominant approaches:
MQTT with a broker (Mosquitto, EMQX, AWS IoT Core): Right for environments with many lightweight sensors publishing small payloads. MQTT is lightweight, handles reconnects gracefully, and most embedded firmware supports it natively. Weak point: no built-in replay or long-term retention.
Apache Kafka (or AWS MSK, Confluent Cloud): Right when you need high-throughput ingestion from many sensors simultaneously, retention for replay and retraining, and consumer groups for parallel processing. Operationally heavier than MQTT but the right foundation when data volume is serious.
In practice, most mature inspection systems use both: MQTT at the sensor layer, Kafka at the aggregation and analytics layer, with a lightweight bridge (Kafka Connect MQTT source connector) between them.
Choosing the wrong pipeline architecture at the start is expensive to fix later. Naxtre's IoT software development team helps IoT product teams design pipeline architecture before any device integration begins, which prevents the most common and costly rework.
Layer 3: The ML Integration and Inference Service
This is the layer that handles the actual AI work: receiving preprocessed sensor data, running it through the model, and returning a structured result. But from a software perspective, this is an API service, not just a model file.
The inference service needs to handle:
- Request validation: Reject malformed payloads before they reach the model. A corrupt image frame or an out-of-range sensor reading should return an error, not a silent wrong prediction.
- Preprocessing pipeline: Image normalisation, resizing, noise filtering, and feature extraction run here. This layer is separate from the model itself so it can be updated without redeploying the model.
- Model versioning: The service needs to support A/B deployment, where a new model version runs in shadow mode against the current version before replacing it.
- Confidence thresholding: Low-confidence predictions should route to a human review queue rather than making an autonomous pass/fail decision.
- Async vs. sync modes: High-throughput stations need async inference with a callback. Lower-volume stations can use synchronous REST calls.
A common architectural mistake is building the inference service as a monolith that couples preprocessing, inference, and integration logic into a single codebase. When your defect taxonomy changes (and it will), you end up rewriting more than necessary. Keep them as separate services or at minimum separate modules with clean interfaces.
Layer 4: The Decision Integration Layer
Model output is a prediction. The decision integration layer turns that prediction into an action inside your production environment.
This layer handles three distinct integration patterns:
- PLC integration: Writing pass/fail decisions back to the programmable logic controller that controls the line. This typically happens via OPC-UA (the standard protocol for industrial automation) or Modbus TCP. The decision must arrive within the PLC's scan cycle time, typically 50 to 100 milliseconds.
- MES integration: Writing quality records to the Manufacturing Execution System. Most MES platforms expose REST APIs or SOAP endpoints. Some require OPC-UA server connections. This integration creates the audit trail that compliance teams and customers rely on.
- ERP integration: Escalating defect events to ERP systems for materials traceability. Usually lower frequency than MES writes, often event-driven via webhook or message queue.
This integration layer is where AI development expertise and IoT integration knowledge have to work together. Teams strong in ML but unfamiliar with industrial protocols often underestimate the complexity of this layer and discover it only when commissioning begins.
The MLOps Layer: Why 60% of Inspection Projects Degrade After Launch
According to a 2026 analysis by Gartner, more than half of production AI deployments show measurable performance degradation within six months of launch. In inspection systems, this manifests as rising false positive rates, increasing defect escapes, or both.
The cause is almost always model drift: the production environment has changed in ways the model was not trained for. New material batches, equipment wear, seasonal temperature changes, or new product variants all shift the input distribution away from the training data.
A complete AI IoT quality inspection software stack includes:
- Performance monitoring API: Track precision, recall, and confidence score distributions per station, per shift, per product SKU. Alert when metrics cross defined thresholds.
- Labelling pipeline: Flagged units from the human review queue should flow directly into a labelling workflow. Confirmed defects become new training data without manual export and import steps.
- Retraining trigger: When performance drops below threshold, a retraining job should fire automatically. The new model trains on the expanded dataset, runs validation checks, and waits for shadow deployment approval.
- Shadow deployment API: New models run in parallel with the production model. Their predictions are logged but do not trigger actions. When shadow model performance exceeds production model performance for a defined window, promotion is automatic.
- Rollback endpoint: If a promoted model degrades, an API call restores the previous version without redeployment.
Teams that build these MLOps capabilities into their inspection software from the start spend significantly less time firefighting six months later. Teams that treat the initial model as the finished product spend that time diagnosing drift they cannot quickly fix.
Build vs. Buy: What the Decision Actually Depends On
The build vs. buy question for AI IoT inspection software is usually framed around budget. That is the wrong frame. The right question is: how frequently does your defect taxonomy change?
If you produce a single product line with stable, well-defined defect types, a commercial vision inspection platform may outperform a custom build. You get faster deployment, maintained integrations, and vendor support. The platform's fixed capabilities are not a constraint when your requirements are fixed.
If you produce multiple SKUs, run frequent line changeovers, or operate in a domain where defect definitions evolve with customer requirements, a platform's fixed taxonomy becomes a liability. You end up working around the platform rather than working with it. Custom software built on open ML frameworks adapts faster to changing defect profiles.
Three other factors that matter:
- Data ownership: Commercial platforms often require your training data to be uploaded to their cloud. If your production data is sensitive, proprietary, or subject to data residency requirements, a self-hosted custom stack gives you control that platforms cannot match.
- Integration depth: Platforms vary significantly in their industrial protocol support. Before evaluating any platform, map your existing MES and PLC integration requirements and test them, not just the demo.
- Team capability: A custom stack requires MLOps skills, API development skills, and industrial integration knowledge. If all three do not exist in-house, a platform reduces the knowledge gap but introduces vendor dependency.
How to Structure the Software Project: Phases and Milestones
Most AI IoT inspection software projects fail in production not because the technology does not work but because the project was scoped as a single deployment rather than a phased software product.
A phased approach that works in practice:
- Phase 1 (weeks 1 to 4): Data pipeline and device integration. Get sensor data flowing reliably into your system before touching ML. A pipeline that drops 0.5% of events is a problem you need to find now, not after the model is trained.
- Phase 2 (weeks 5 to 10): Baseline model and edge API. Train on the best available labelled data. Deploy to edge. Measure real latency against your line requirements. Identify preprocessing gaps now.
- Phase 3 (weeks 11 to 16): Decision integration and MES/ERP writes. Commission the OPC-UA or REST integration with production systems. Validate audit trail completeness. Run shadow mode against manual inspection for two to four weeks.
- Phase 4 (weeks 17 to 20): MLOps infrastructure. Build the monitoring dashboard, labelling pipeline, and retraining trigger before you go live. These are not optional extras; they are what makes the system maintainable.
- Phase 5 (post-launch): Continuous improvement. Review threshold settings monthly for the first quarter. Retrain quarterly or when performance metrics flag. Add SKUs and defect types incrementally.
Teams that skip Phase 4 until after launch consistently spend their first six post-launch months backfilling MLOps capabilities they should have built first.
What the 2026 Market Data Says About AI Quality Inspection Adoption
The global AI-powered quality inspection systems market is growing rapidly as software-driven inspection replaces manual sampling. According to market analysis from 2026, adoption is being driven primarily by software integration improvements rather than hardware advances. The cameras and sensors existed five years ago. What has changed is the software ecosystem around them: better open-source ML frameworks, lower-cost edge compute APIs, and mature message queue infrastructure that reduces the integration complexity that previously blocked adoption.
The pattern this creates for software teams: the competitive differentiation in AI IoT quality inspection is shifting from model accuracy (increasingly commoditised) to pipeline reliability, integration depth, and how fast the system can adapt to new defect types without redeployment.
API Design Patterns That Make AI Inspection Software Easier to Maintain
The long-term maintainability of an AI inspection system depends heavily on how the component APIs are designed at the start. Patterns that hold up well in practice:
Decouple inference from business rules
The inference service returns a prediction and a confidence score. The decision service applies business rules (thresholds, escalation logic, multi-model ensembling). Keeping these separate means you can update thresholds and escalation rules without redeploying models, and vice versa.
Version your model APIs like software APIs
Treat /api/v1/inspect and /api/v2/inspect as separate endpoints during model transitions. This lets you route a percentage of traffic to the new model while keeping the old model as a fallback without a flag-day cutover.
Build inspection events as first-class data objects
Every inspection event (input payload, model version, prediction, confidence, decision, timestamp, unit ID) should be stored as a structured record, not a log line. This makes audit trail queries straightforward, enables retraining data selection by date or SKU, and supports compliance reporting without custom tooling.
Design for reconnect, not for always-connected
Factory networks are not cloud networks. Intermittent connectivity is a reality. Your device clients should buffer inspection events locally and replay them when connection is restored. Your pipeline should be idempotent so replayed events do not create duplicate records. Most teams discover this requirement the first time a network switch fails during a shift.
How Naxtre Approaches AI IoT Inspection Software Development
When IoT product teams come to Naxtre to build inspection capabilities, the first engagement is always an architecture review. We look at sensor protocols, existing system integration points, data volume, latency requirements, and team capability before recommending a technology stack.
The most common finding from those architecture reviews: teams have invested in hardware and underinvested in the software layers that connect it. The sensors work. The data pipeline is fragile. The integration layer is held together with brittle scripts. The model was trained once and has never been retrained.
We work with product teams to design the full software stack: edge inference APIs, MQTT and Kafka pipeline architecture, MES and OPC-UA integration, and the MLOps layer that keeps the system accurate as production conditions change. If you are at the architecture or vendor evaluation stage of an AI inspection project, contact the Naxtre team for a technical review before you commit to an approach.
Frequently Asked Questions
What software is needed for AI IoT quality inspection?
An AI IoT quality inspection system requires four software layers: an edge inference API (running the ML model locally), a data pipeline (MQTT broker or Kafka for sensor data ingestion), an ML integration service (handling preprocessing, versioning, and confidence routing), and a decision integration layer (writing results to PLC, MES, or ERP via OPC-UA or REST API). MLOps tooling for monitoring and retraining is essential for long-term accuracy.
What is the best data pipeline for IoT inspection systems?
MQTT is the right choice for lightweight sensor networks with many low-power devices. Apache Kafka (or managed equivalents like AWS MSK or Confluent Cloud) is the right choice when you need high-throughput ingestion, long-term data retention for retraining, and consumer groups for parallel processing. Most production systems use MQTT at the sensor layer and Kafka at the aggregation layer, connected by a Kafka Connect MQTT source connector.
How do you integrate AI inspection results with an MES system?
Most MES platforms expose REST APIs or SOAP endpoints for quality record writes. Some require OPC-UA server connections. The integration writes a structured inspection event record (unit ID, timestamp, model version, prediction, confidence score, decision) to the MES after each inspection. The critical requirement is that this write must complete within the PLC scan cycle time (typically 50 to 100 milliseconds) if the MES drives line-stop decisions.
What is model drift in AI quality inspection and how do you prevent it?
Model drift occurs when production conditions diverge from the training data distribution. Common causes include material supplier changes, equipment wear, seasonal environmental variation, and new product variants. Prevention requires a performance monitoring API that tracks precision and recall per station, a labelling pipeline that feeds confirmed defects back into training data, and an automated retraining trigger that fires when performance metrics cross defined thresholds.
What is OPC-UA and why does inspection software need it?
OPC-UA (Open Platform Communications Unified Architecture) is the standard protocol for industrial automation system integration, supported by virtually all modern PLCs, SCADA systems, and MES platforms. AI inspection software that writes decisions via OPC-UA integrates natively with factory automation without custom adapters. It also supports read access to PLC data (line speed, batch ID, shift data) that the inspection system needs for contextual logging.
Should I build or buy AI quality inspection software?
Buy a platform if your defect taxonomy is stable and well-defined, your production environment uses standard protocols the platform supports, and speed to deployment matters more than flexibility. Build a custom stack if your defect types change frequently, you have data residency or IP requirements that prevent cloud upload of training data, or you need deep integration with legacy MES or ERP systems that platforms do not support out of the box.
How long does it take to develop AI IoT inspection software?
A phased project typically runs 17 to 20 weeks from pipeline design to live deployment. Phase 1 (data pipeline and device integration) takes 4 weeks. Phase 2 (baseline model and edge API) takes 5 to 6 weeks. Phase 3 (MES and PLC integration, shadow mode validation) takes 5 to 6 weeks. Phase 4 (MLOps infrastructure) takes 3 to 4 weeks before go-live. Teams that skip Phase 4 and build MLOps post-launch typically spend their first post-launch quarter backfilling it.
What programming languages are used for AI IoT inspection software?
Python dominates the ML and pipeline layers: PyTorch or TensorFlow for model training, FastAPI or Flask for inference services, and Pandas or Polars for data processing. Node.js or Go are common choices for lightweight API gateway and device integration services where latency is critical. C or C++ appears at the edge runtime layer when deploying to resource-constrained devices. The MES and ERP integration layer often requires working with industrial SDKs that expose .NET or Java bindings.
AI Search Queries This Article Answers
- How do I build AI quality inspection software for IoT devices?
- What data pipeline should I use for IoT inspection systems?
- How does edge inference work in AI inspection systems?
- How do I integrate AI inspection results with an MES system?
- What is OPC-UA and how does it work with AI inspection software?
- How do I prevent model drift in production AI inspection systems?
- Should I build or buy AI quality inspection software?
- What is the software architecture for AI IoT inspection?
- How long does it take to develop an AI IoT inspection system?
- What programming languages are used for IoT inspection software?
Conclusion
AI IoT quality inspection is a solved hardware problem and an unsolved software integration problem for most teams. The sensors exist. The models exist. The gap is the data pipeline that gets sensor data to the model reliably, the edge API that returns decisions fast enough to matter, the integration layer that writes results to the right production system, and the MLOps infrastructure that keeps accuracy from degrading over time.
Teams that treat inspection as a software product with a roadmap, not a one-time hardware deployment, are the ones seeing sustained results. The inspection system that performs well six months after launch is almost always the one that was designed with retraining, monitoring, and integration depth as first-class requirements, not afterthoughts.
Industry data backs this up: top-performing inspection software platforms in 2026 share one trait: they treat the integration and retraining layer as a core product feature, not an add-on. Whether you build or buy, that is the standard to design to.
The inspection system that performs well six months after launch is almost always the one that was designed with retraining, monitoring, and integration depth as first-class requirements, not afterthoughts.
Let's Talk
About Your Idea!